Track Your Social Syndication Performance with dlvr.it’s Stats Dashboard
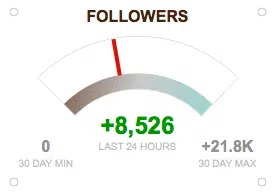
You can now get a quick, up-to-date view of your social syndication performance with dlvr.it’s new stats dashboard. The new dlvr.it dashboard gives you a snapshot of the key metrics across your social syndication routes, including audience growth, item clicks, posting volume, popular items, and geographic distribution.
We’ll compare your most recent 24 hours of activity to the last 30 days. This gives you a clear picture of how your current efforts are shaping up compared to the last 30 days. We’ll also tell you your popular items over the last week and show you where your visitors are coming from.

Now you can keep your finger on the pulse of your social syndication with an easy-to-digest view of your key content distribution stats. To check out your dlvr.it dashboard, log into your dlvr.it account, and go to Stats > Dashboard.
To experience the full power of dlvr.it’s stats dashboard you’ll need to be using dlvr.it’s url shortener to shorten your links. If you’re a bit.ly user, don’t despair! We are beta testing a service to import your bit.ly click stats into dlvr.it. If you are interested in participating in the pilot program fill out the form below.

