
How to Create Amazing Content: Review of a Unique Infographic Maker
Every so often, I have a need for a custom infographic for a blog post. Usually, this is followed by a fleeting thought such as “I can make my own – no problem!” As we all know, with limited time and limited design experience, this is a somewhat impossible feat to accomplish. Until now! Word on the street is there is a new web-based infographic maker that helps you make stunning visual presentations in four easy steps.
I’m up for the challenge.
Here’s what I know about Visme – a free online graphics tool for bloggers, businesses, and other professionals with limited to no design skills.
Visme translates your ideas into engaging content in the form of:
- Presentations
- Infographics
- Reports
- Web content
- Product presentations
- Graphs & Charts
- Wireframes
So what does Visme have to offer you?
Visme — the Swiss Knife of Visual Content
Have you noticed that many visitors come to your website and leave right away?
According to Visme, it is not your content.
The number one reason people leave your website is because of non-stimulating and outdated images.
One of the key features of Visme is that it allows you to take otherwise boring data and transform it into a straightforward and easy to understand visual format.

So, let’s test this out.
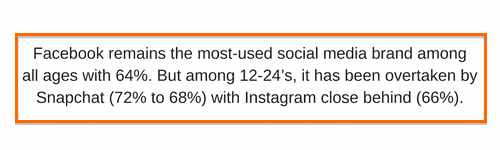
Here’s a “boring” data stat taken from one of our blog posts on Snapchat vs. Instagram Stories: What You Need to Know:
Infographic Maker 101 – How to Create Professional Infographics
Goal: Take the boring stat above and create a beautiful visual presentation.
(Facebook remains the most-used social media brand among all ages with 64%. But among 12-24’s, it has been overtaken by Snapchat (72% to 68%) with Instagram close behind (66%).)
According to Visme, creating infographics is easy. You can start with a blank canvas and introduce your own elements and design, or you can start from a series of starter infographic maker templates to use as a great starting point to create from.
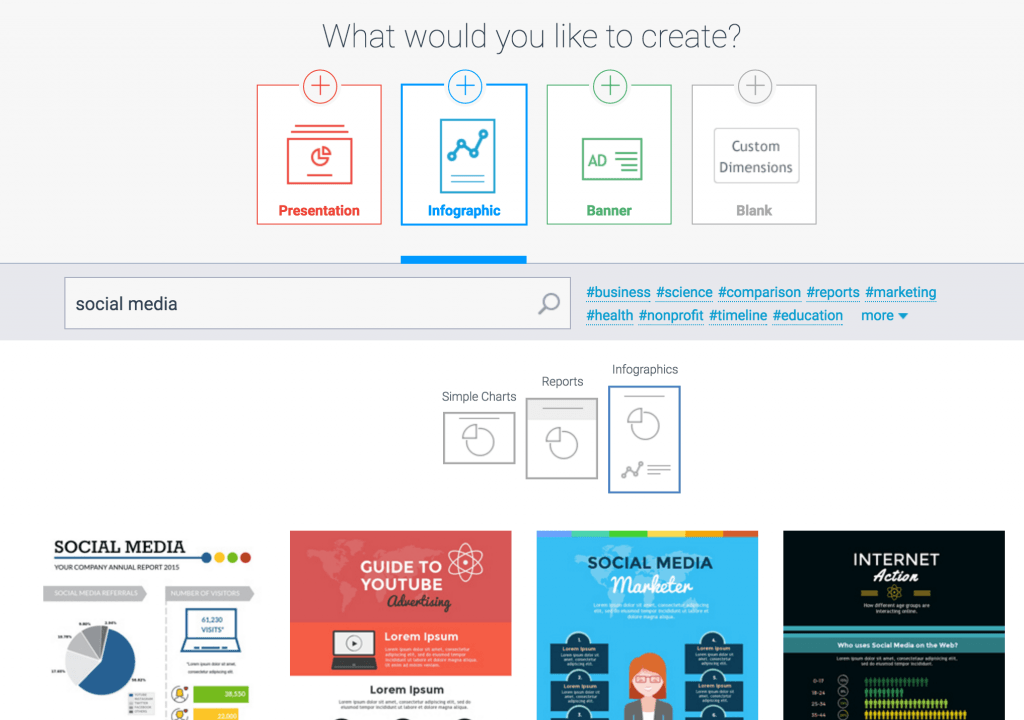
Step 1: Select an infographic maker template
Visme has numerous infographic templates to choose from. Select one that best meets your design needs. It’s easy to customize so don’t worry if the template isn’t a perfect match.
To start my boring stat infographic, I searched through the templates using the keyword “social media”.
Step 2: Create an outline of your topic
The purpose of an infographic is to translate a theme or idea into the form of visual content. Therefore before you populate your infographic, step back and ask yourself a few questions:
- What is the purpose of the piece?
- Who is going to be my audience?
- What message do I want to portray to the viewer?
Pro tip: There is no right or wrong, but make sure you do have a clear picture of what you want to create before you do begin the process.
Here’s my outline:
Purpose: Take a boring stat and turn it into an interesting visual
Audience: Our blog readers
Message: Wow, that’s interesting!
Step 3: Select from the free assets and upload your own
Now that I’ve picked my theme, I can do any one of the following:
1 – Create a chart or graph. Each chart can be customized with specific bits of data to fit your data needs.
2 – Use the infographic widgets.
Infographic widgets are exclusive mini apps that allow users to quickly translate otherwise boring data into simple and easy to understand snackable pieces of content that are easy to digest.
3 – Add footnotes and references
Step 4: Publish your infographic
This final step is super easy. Review in preview mode then hit publish and voilà…
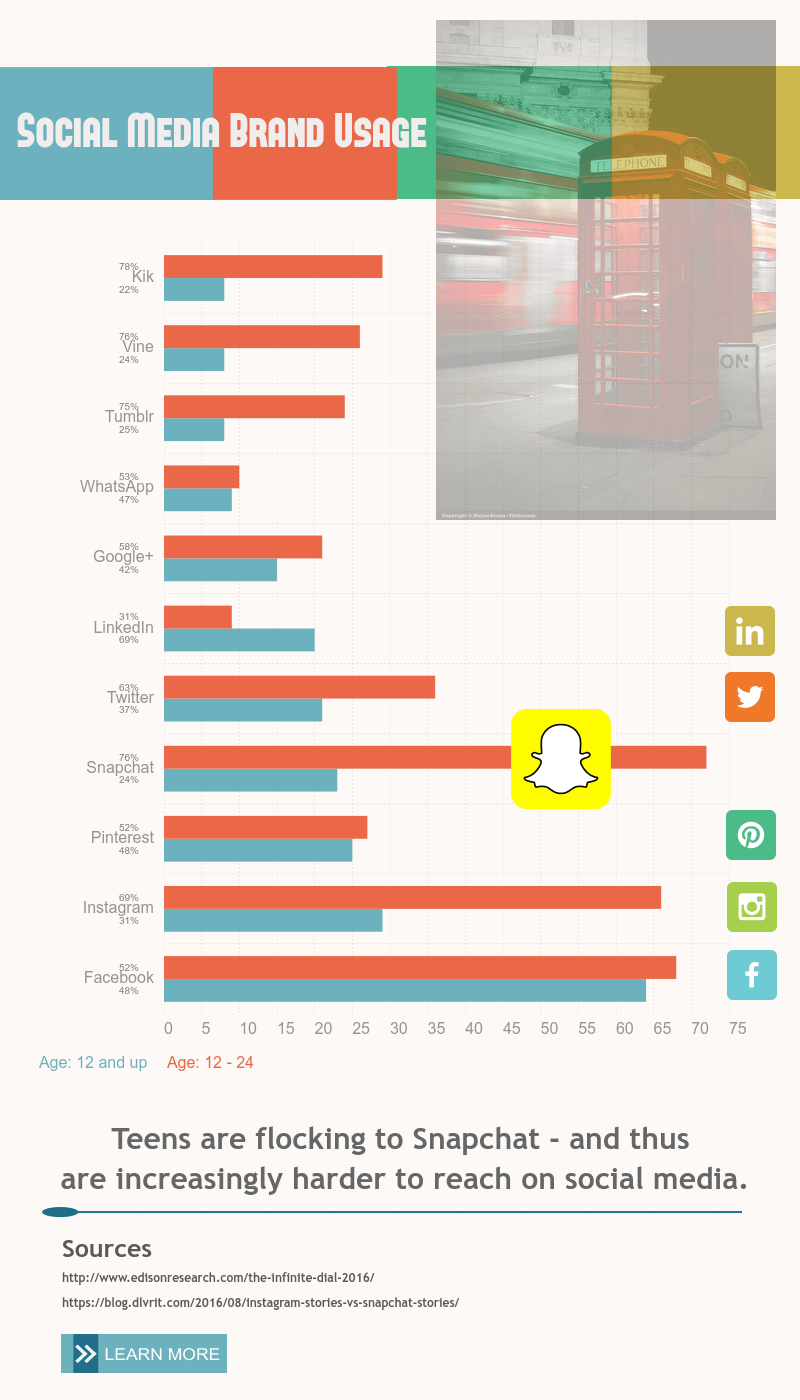
Boring Stat Infographic: Teens are flocking to Snapchat
My thoughts on Visme (so far):
1 – The app is fairly user intuitive but took a little longer to create my first infographic than I would have hoped for – because there is so much you can do, the tools and settings aren’t entirely intuitive, resulting in a steeper learning curve.
2 – I couldn’t find the Snapchat logo in any of the button sets, so I tried uploading one from my desktop. This process was not easy – again, a learning curve but after a few attempts, I was finally able to load the image.
3 – The animations are fun and simple to do. If you reload this page, check out the animations on my “Boring Stat Infographic”.
With that said, I can’t wait to use Visme again.
What else can Visme do?
As mentioned earlier in this post, Visme is much more than just an infographic maker. I haven’t tried these yet, but you can also do the following:
1 – Presentations
If you’re tired of PowerPoint, Visme offers some beautiful presentation templates for you to use, each with its own collection of slide layouts.
Once you complete your presentation, you can present online via Visme or download your slides as images and paste them into Powerpoint.
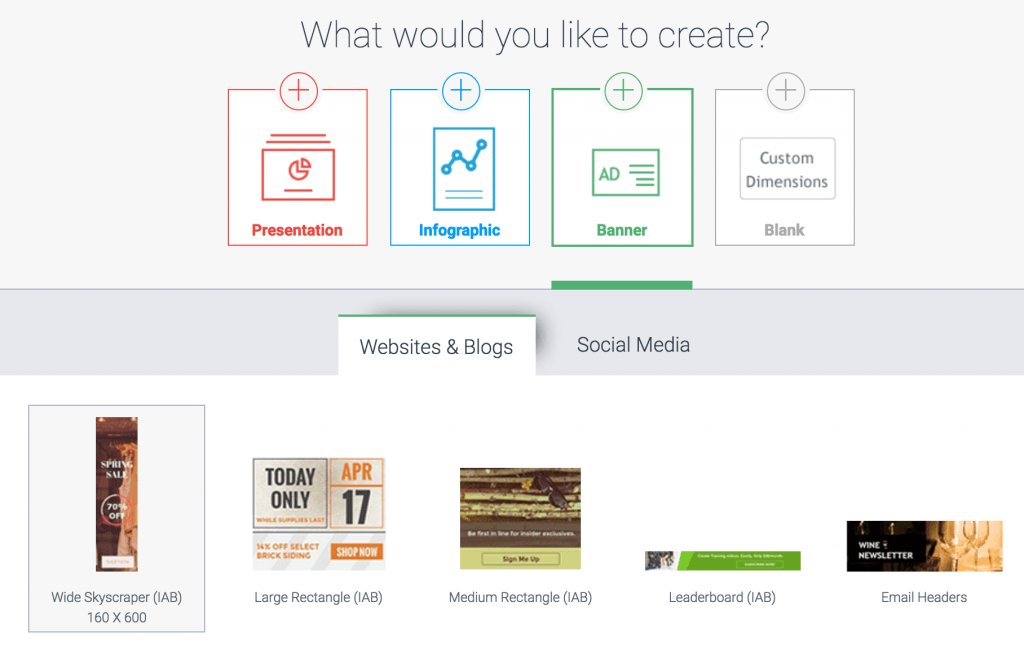
2 – Banner Ads
If you advertise online, you can use Visme to create attractive and engaging banner ads in many shapes and sizes.
Even if you don’t advertise, banner ads can be utilized on your own site as calls to action, driving your website visitors to take the next step in your sales process.
Here’s a snapshot of five different default banner types and their sizes
3 – Custom
The custom design area of Visme is one of its strengths, enabling you to use their tools to easily create any type of image, including those share-worthy memes that pepper your social media streams.
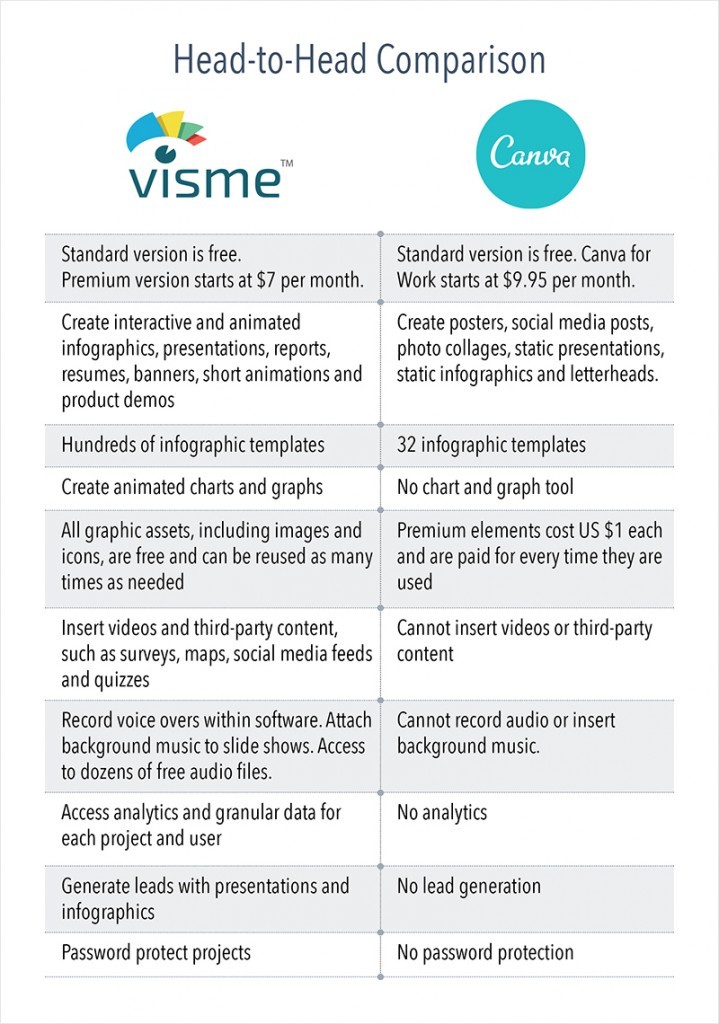
So, what’s the difference between Visme and Canva?
Well-known graphic design tool Canva is an amazingly simple DIY tool for everyone – non-designers as well as professionals. For a refresher course on why we like Canva, check at our post on How to Use Canva to Create Beautiful Graphics for Social Media.
However, when it comes to an easy-to-use infographic maker and ability to create interactive presentations, Visme is one of the few visual content creation tools that allows you to add interactivity and animation to all your designs and collaborate with other team members on projects.
Here’s one side of the story from Visme on Canva Versus Visme: What’s the Difference?
In conclusion, Visme is different because:
- It does more than just create one type of content and every template is completely customizable.
- Ability to make any object interactive and add motion.
- Easy publishing. You can download, share directly through social links, or embed in your site.
The embedding option is particularly cool, as it means you can include animations to liven up presentations and reports when they are embedded, adding visual interest to what could otherwise be a boring set of static slides and statistics.
- Fully HTML5 based so content is both web and mobile friendly.
Inquiring minds want to know:
Would I personally recommend this service? YES, with a caveat. Once you get used to the program, you’ll be able to do more than you ever expected. However, if you don’t have time, or only need an occasional graphic, Visme may not be for you.
___
Visme also has great blog content. For more creative ways to use Visme, here are some good finds from their blog:
- Interactive Slideshow: How to Create an Interactive Slideshow with Visme
- Graphs & Charts: The Do’s and Don’ts of Chart Making
- PowerPoint Slides: How to Import Your PowerPoint Presentation Into Visme
- Record Audio in your Presentation: How to Create a Narrated Presentation With Voice Over Using Visme
___
Have you used Visme? What’s your favorite infographic maker? Share your thoughts in the comments.


