The Path from Post to Profit; Metrics Behind Measuring and Proving your Blog Strategy
My husband just gave me one of those looks when I told him I was writing about the path to profitability through a solid metric-based blog strategy. Yes, I admit, I am an accounting geek who enjoys tracking KPI’s and ROI’s. Too many acronyms in one sentence for my husband but for me, frankly, they are what we live and breathe here at dlvr.it. Both are equally important measurement tools used by us to gauge if our time and focus is in the right place and if these efforts prove to be profitable. Simply put, they are our blueprint to success.
Putting on my non-financial hat and brushing up on what I learned in business school:
By defining and monitoring the right KPIs, you can gain valuable insight into your business and make the adjustments needed to optimize your performance. The challenge is knowing which KPIs are most important to monitor to get the results you want.
Let’s look at an example from our dlvr.it business. We focus our marketing efforts on creating and sharing content our audience enjoys. We look at both the short and long term. Our success metrics look like this:
Blogging + Social Sharing = Traffic to the Blog = Conversion
With the ultimate goal being conversion, we track conversion activity in this order of priority:
-
New paid dlvr.it customer
-
New non-paid dlvr.it user
-
Newsletter sign-up
-
Fan or Follow
-
Time on site and blog

Metric #1: Blog Measure – Traffic
Directly from our blog we track and plot the following week over week and month over month:
-
# of visits
-
# of unique visits
-
# of pageviews per visit
-
Average # of pages per visit
-
Duration (time on site in minutes)
-
% bounced
-
% new visits
-
How many posts
Our findings: What can our blog traffic tell us?
Short answer… plenty!
-
By tracking the variances, we can easily see what content is resonating with our audience and what falls short
We noticed that our “how to” posts outperformed our “productivity tips” posts by 70% leading us to change the mix of our posts: 3 to 1
-
When is the ideal time to post?
We noticed that our blog traffic spikes on Monday morning. Not so coincidentally, our weekly email stats updates start rolling out to our users early Monday morning. We also noticed that our blog traffic is significantly flat on the weekend, no need to post then.
-
How many times should we post each week?
The ideal number of posts is still a work in progress but we are playing with various mixes and tracking results for 2 vs. 3 vs. 4 posts per week. We see a 25% lift when we post more than 2 times per week. We will need to make the determination whether or not a 25% lift justifies the time and expense of creating a new blog post.
Metric #2: Site Measure (short term) – Conversion
From the inbound traffic from our blog to our main site, we track and plot the following week over week and month over month:
-
# of visits
-
Average # of pages per visit
-
Duration (time on site in minutes)
-
% bounced
-
% new visits
-
% of conversion to our free product
-
% of conversion to our paid product
Our findings: What can traffic from our blog to our site tell us?
Short answer – again, plenty!
-
By tracking the increase in conversations, we can easily see if our blog posting strategy is working.
We noticed a 100% increase in conversions when we increased our blog posts from 1-2 posts per month to 2 or more posts per week.
-
When is the ideal time to post?
We noticed a significant spike in conversions when our weekly stats email referenced our blog.
Metric #3 – Site Measure (long term) – Search
Our content strategy is a balance between content that creates an immediate lift in traffic and conversions, and evergreen content that will be discovered through search or other means over time. We understand content marketing is suited for a marathon but that doesn’t mean we don’t sprint part of the way.
We view our blog and our content strategy as a pot of boiling water. A pot of boiling water doesn’t immediately boil when the heat is turned on. It takes a consistent heat source to make the pot boil.
We see 24% of our blog posts from six months ago, land in our top three pages viewed for any given week. In addition, posts we wrote last year continue to pop into our top list of most popular for traffic and conversion.
A couple key things to consider when determining your company specific KPI’s:
-
Not all companies are alike and not all metrics fit into a standardized hole. Spend time early in the start of your business to determine your goals and metrics.
-
Make sure your goals are measurable and identify success metrics specific to your business and industry. These can vary from business to business and project to project, depending on your short-term and long-term goals
-
Continually evaluate, review and analyze your KPI’s as they may change and evolve over time
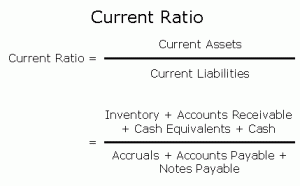
As the next step in the process, I put on my finance hoodie, apply Accounting 101 thinking and ask myself, “is our blog strategy creating a positive Return on Investment (ROI)?” As a regular blog contributor and the resident accounting geek, I bring a unique perspective. I experience firsthand the results our blog generates. As any marketing person would, I get excited when someone comments or shares my content. However, being intimately familiar with ROI metrics relating to the financial health of a company, my primary objective is to help determine if our initiatives make fiscal sense. The following is one of dlvr.it’s key metrics in evaluating the businesses short and long-term health:
The Current Ratio helps us to determine whether we are able to pay off all our debts by using our current assets. When we see consistent conversions from the KPI’s of our blog strategy, we are guaranteed a quick ratio greater than one!
-
The ideal quick ratio is right around 1:1. This means you have just enough current assets to cover your existing amount of near-term debt.
-
A higher ratio is safer than a lower one because you have excess cash. The drawback of maintaining a high quick ratio is that you may not be making effective use of your cash to grow your business.
-
A low quick ratio is generally a more risky position since you don’t have adequate current assets. A significant downturn in sales could leave you in a bind. A low ratio also causes concern with potential investors and creditors because of your short-term risks.
For other key financial metrics for small businesses, check out the top 10 financial ratios and metrics your business should monitor from Klipfolio – The KPI dashboard.
While not a new idea, the marriage of KPI’s and ROI in dlvr.it’s blog strategy, was an “aha moment” for us. It now serves as our blueprint to long-term success:
KPI Metric #1: Blog strategy (traffic, content mix, focus and # of posts) =
KPI Metric #2: Conversions =
KPI Metric #3: SEO =
ROI: Healthy Profitable Company
And, that is what interests this accounting geek – metrics, graphs and spreadsheets – all tools to follow the path to profitability starting with the blog!


