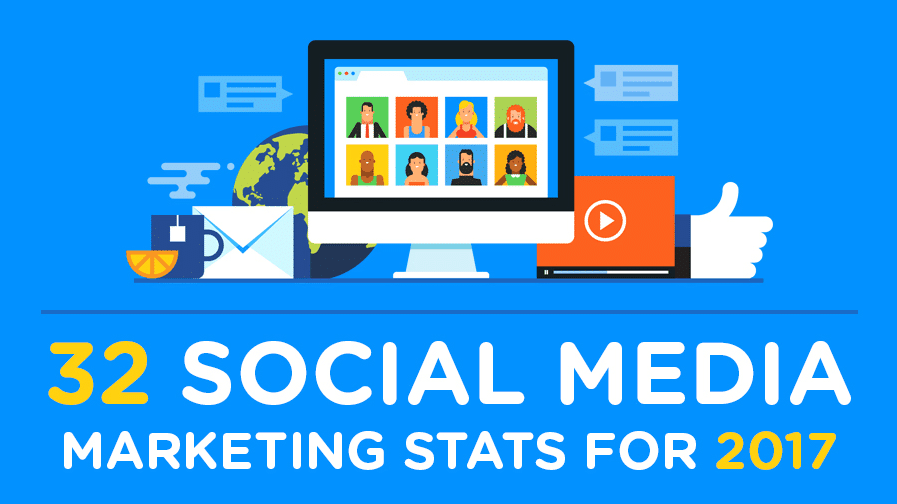
Top Social Media Marketing Stats for 2017 — INFOGRAPHIC
The social media marketing landscape seems to change by the hour. Hot new social media trends emerge and disappear with astonishing speed. How does a social media marketer make sense of all the hype? It’s always good to start with the data.
The actionable social media marketing stats in this infographic will help you chart your social media marketing strategy for 2017. Here are some of the key insights:
Facebook is Dead. Long Live the King.
With the rise of new social networks like WhatsApp and Snapchat, many pundits have been predicting the demise of Facebook. This may be true, eventually. But as of 2017 Facebook remains the top social network in the world.
A whopping 79% of all US internet users are on Facebook. Looking more broadly, Facebook reaches 68% of all US adults (not just internet users). Despite the hype and excitement surrounding the new social media networks on the block, Facebook remains the undisputed leader.
Your social media marketing strategy for 2017 should include a big dose of Facebook.
Pinterest Drives Retail Shoppers
If you’re a retailer, Pinterest should be at the top of your social media marketing shopping list for 2017. The image-centric social network has become one of the largest drivers of retail referral traffic on the internet. Pinterest now drives 25% of all retail referral traffic. Moreover, 93% of Pinterest users are there to plan and make purchases.
Let’s go shopping!
Images and Videos Boost Engagement on Social Media
Sharing images and video on social media works. This should come as no surprise to savvy social media marketers. Here’s some hard evidence to back up what you’ve already known about social media and rich media posts.
- Twitter: Tweets with images receive 18% more clicks that tweets without images.
- LinkedIn: Posts with images result in more comments.
- Facebook: Over 100M hours of youtube video are watched on Facebook daily
- Snapchat: 400M Snaps shared per day, or 9,000 Snaps shared per second
Mobile Is Where Social Media Happens
The vast majority of time spend on social media happen on mobile devices.
- More than 80% of time spent on social media platforms happens on mobile devices
- More than 50% of all YouTube video plays are on mobile
Social Media Marketing Stats for 2017 Infographic
This smart infographic is from Red Website Design. The infographic visualizes data from The Wordstream Blog.

