
3 Informative Twitter Analytics Reports With the Most Value
Twitter Analytics provides detailed performance stats that are not accessible by 3rd party social media analytics tools. These stats contain a wealth of information and are available to anyone who has created a Twitter account. However, the key is to understand how to unlock this meaningful data to get the most value.
Generally speaking, Twitter stats are a view of ‘what happened.’
Just like most tools, the results are only as good as your strategy and the work you put in. In this post, we’ll provide a few tips on improving your Twitter social media marketing strategy based on your Tweet stats.
First, think about these questions:
What’s your Social Media Marketing Strategy for Twitter?
Why did you set up shop on Twitter? What did you hope to achieve?
Some of the main reasons you may be using Twitter include:
- Sharing information and content
- Driving engagement for promotional activities
- Interacting with prospects and customers
- Networking
- Branding
- Reputation management
Lee Oden from Top Rank Marketing Blog challenges you to answer the question:
Where does Twitter fit into your marketing strategy?
Understanding where Twitter fits within the overall mix of online marketing and communications will help with: allocating, monitoring and engagement of resources, establishing a working social media policy, workflow management and reporting.
Once you answer the question of why (see above), you can then build your Twitter analytics strategy to find the answers you need within the stats that Twitter provides.
When you view your Twitter stats, ask yourself a few questions:
- How does time of day and day of the week influence the performance of your tweets? Do certain times lead to more impressions?
- What is your optimal tweet frequency? Are you burning out your audience by over-tweeting or can you stand to tweet even more than you currently do?
- Is your audience more responsive to a fun and conversational tone or more business-like, professional-sounding tweets?
- How does media perform in your tweets? Do people love videos and photos, or do they prefer text-based tweets?
- How does link placement in your tweets impact engagement?
- What kinds of calls-to-action (CTA) generate the most engagement with your audience? Are blatant CTAs more impactful, or does your audience appreciate subtlety?
(Thanks to Hubspot for this great list of questions.)
How to Access Twitter Analytics
The good news is that Twitter Analytics is FREE.
The dashboard is the best place to find detailed information about how your tweets are performing. The analytics dashboard also provides you with performance graphs for the last 28 days. You can also see all your Tweet interactions and the best tweets you shared.
PRO TIP: Append your Tweet URLs with UTM parameters for even more insight inside Google Analytics.
With Twitter Analytics you can view:
- Total tweets posted
- Impressions those tweets received
- Overall engagement and engagement rate
- Top Tweets
- Number of visits to your profile
- Total mentions
- Follower count
- Total retweets and who retweeted
- The reach of your retweets
- Most engaged followers
- Total Likes
To start:
1 – To quickly access the data, you can go straight to analytics.twitter.com.
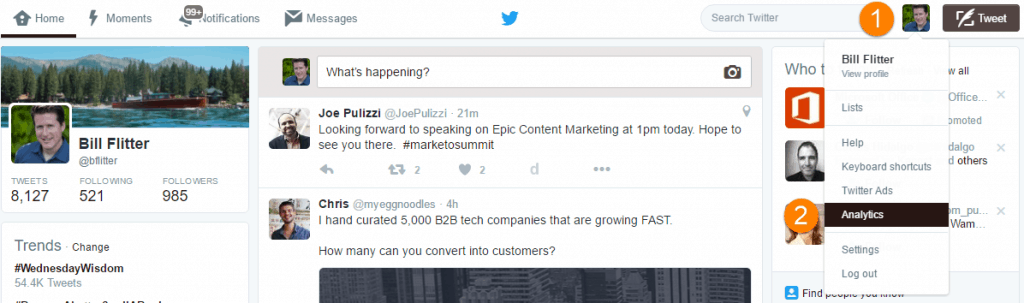
2 – Alternatively, once you log into your Twitter account, you can access Twitter analytics through these steps:
Step (1): Click your avatar in the upper right to expose the drop down menu
Step (2): Click Analytics
Within your analytics dashboard, you will see a menu along the top of the page with several options. See example below. Make a mental note of this as we will be exploring a few of these menu options throughout this post.
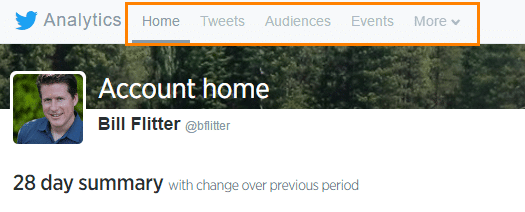
Navigating Twitter Analytics
Social Media Examiner explains the importance of Twitter analytics as, “Being able to mine your Twitter data for a deeper look at what’s working and what’s not is a major factor in promoting your brand on Twitter.”
Personally, I’ve found a lot of value hidden in Twitter stats to help improve my Twitter marketing strategy. I can also test what I find on Twitter on other social networks – an added benefit!
I’ll be covering the following topics and will use real examples:
- Audience Insights
- Audience Comparisons
- Best Performing Tweets
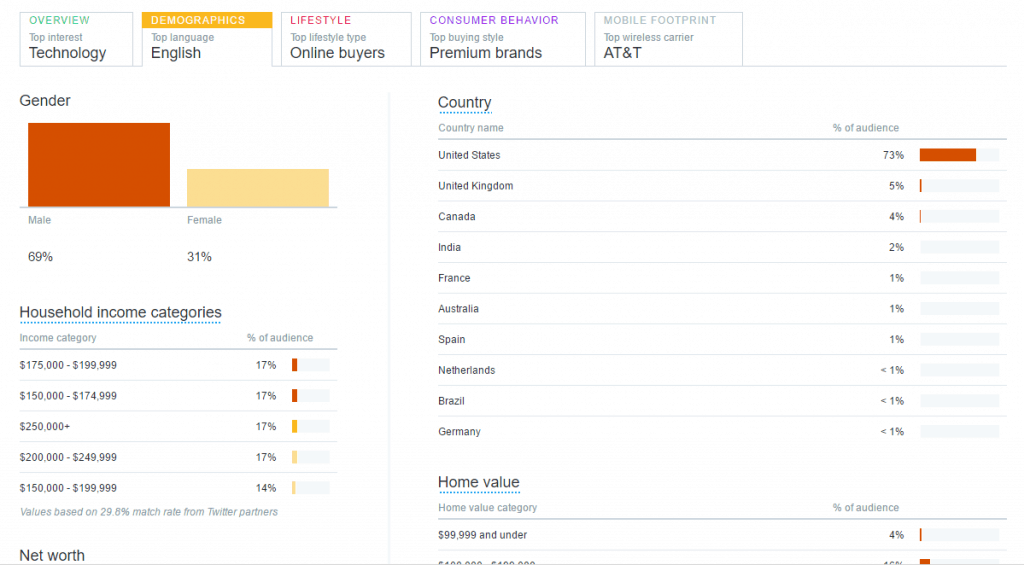
1 – Audience Insights
Click the ‘Audiences’ tab at the top of the Twitter Analytics page (see diagram above) and you’ll see detailed stats on your followers, including:
- Demographics: Gender, County, Household Income, Net Worth, Languages, Home value, Region
- Lifestyle: Interests (by category), TV genres
- Consumer Behavior: Aftermarket auto buyers types, Consumer buying styles, Consumer goods purchases
- Mobile Footprint: Wireless Carrier, Device categories
Newbie Tip: If your audience is not sufficiently large enough to provide insights, read How to Get Twitter Followers in 7 Easy Steps.
2 – Audience Comparison
The above provides me with a great level of detail on my Twitter followers. However, one of the hidden gems is the audience comparison feature.
I can compare my followers to what Twitter calls “organic audience.” Your organic audience looks like this:
Your followers + Your followers’ followers
= Your Organic Audience
For example:
If your follower retweets your content, your content is exposed to that audience of your followers = viral marketing!
In the example below, I compare my Followers to my Organic Audience.
(1): My Followers
(2): My Organic Audience
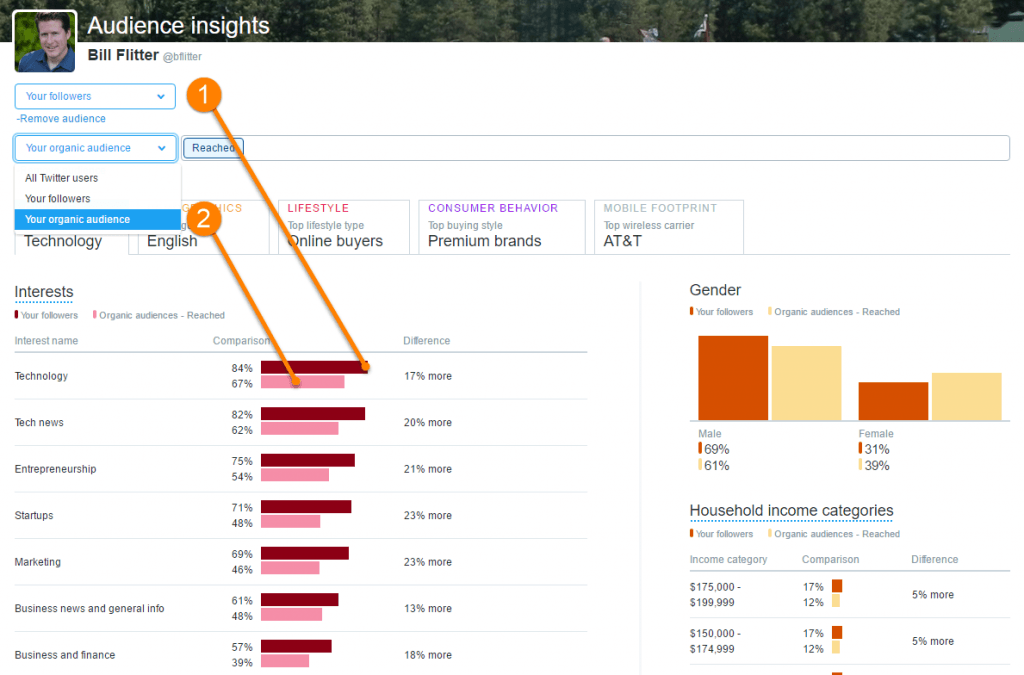
This comparison can be helpful to understand future content decisions.
Example #2:
- Goal: Broaden my reach
- Organic audience assumption: Shows more interest in Tech News
Taking your goal and the interest of your organic audience into consideration, what should you do:
1 – Look to share more content on topics that were of interest to both my followers and my organic audience, rather than topics that were interesting to just my followers
2 – You can also compare your audience to a Persona (parents, generation x, small businesses, etc.). This comparison is extremely valuable if your target market fits into one of the Twitter Personas.
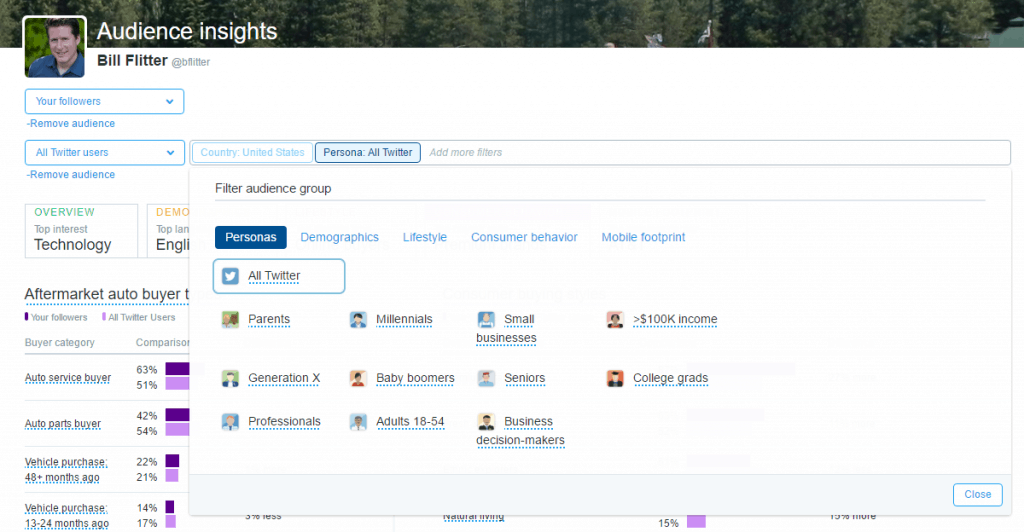
This comparison provides insight into the Persona groups interest and whether or not your current efforts are on target to attract that type of follower.
It also compares them to your current audience. Here again, I might look to share more content on topics that resonate with the Persona group.
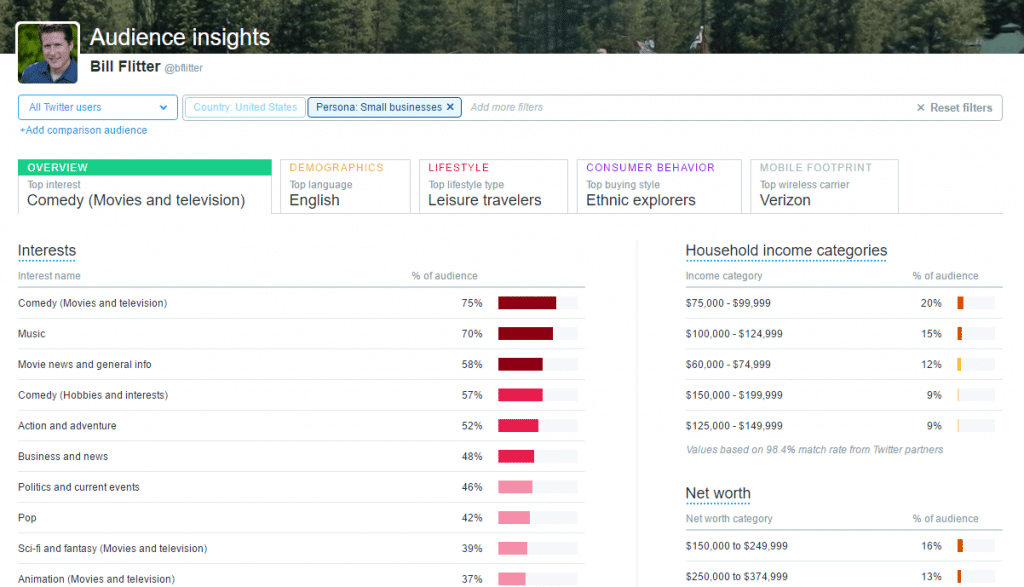
Example #3:
- Goal: Reach Small Business owners on Twitter.
Remove the comparison from the query and you have just the Small Business Persona Interests. Again, you can tailor your content strategy to fit the interests of the target market.
3 – Best Performing Tweets
The Tweets tab holds the answer to what content is resonating with your followers. If your engagement looks flat, review the above reports. Maybe you’re missing a key interest area.
To access Tweet analytics, click the Tweets tab (see image below).
In the example below, I’ve highlighted my Top Tweet. This tweet tells me that my audience is interested in mobile marketing solutions. I curated this article, so the results are interesting because it also provides me with a great topic for my next original blog post! Furthermore, of my top-performing tweets, 90% included an image.
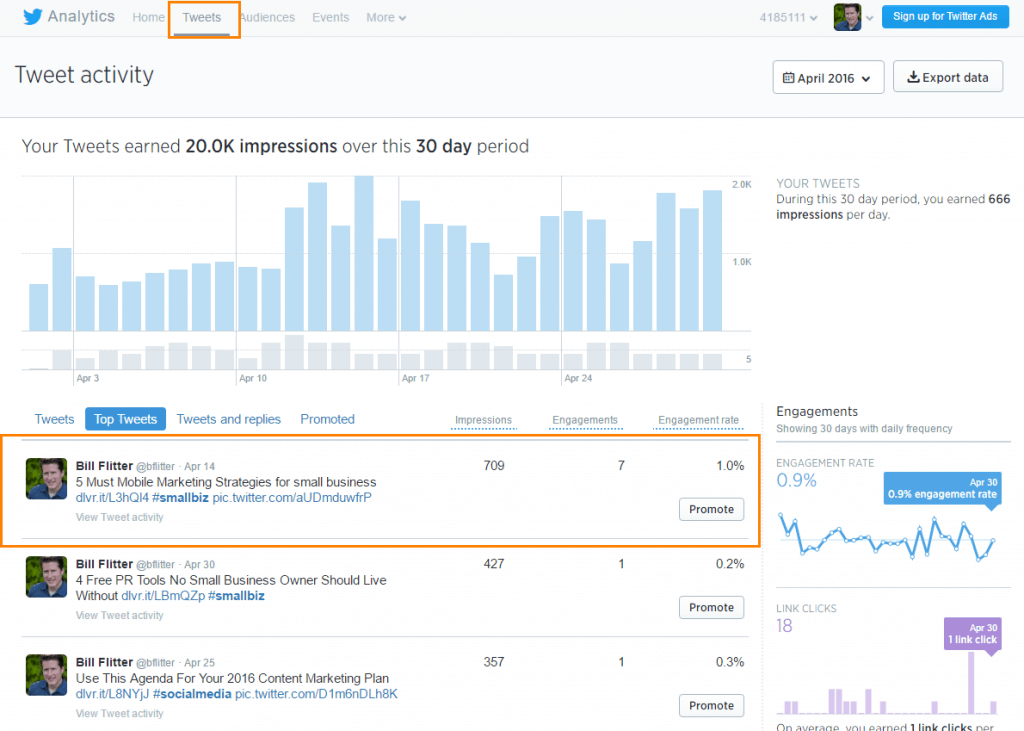
Twitter provides the following stats on each Tweet:
- Total # of impressions
- Engagements (retweets, likes): Total # of times a user has interacted with a Tweet.
- Engagement rate (clicks, retweets, replies, follows and likes divided by total # of impressions)
The ‘top’ tweet in the image above, also had the most impressions. As I look through my data, I see other tweets had fewer impressions but a higher engagement rate. Since engagement is more important to my marketing initiatives, I put more weight on the details of those Tweets (i.e., what was the headline, call-to-action, and image, etc.). I want to repeat what works.
What do I do with the Twitter Stats?
The data should bring to light what you need to change or what works.
For example:
You are a real-estate agent that sells high-end homes. Your Twitter demographic data clearly points to the fact that your audience’s household income is well below your target audience. Time to tweak your content strategy and find new people to follow.
List of other action items Twitter analytics may create:
- Use Twitter search to find new people to follow based on the Twitter Interest category data (e.g. find more people like “x”)
- Identify what Tweet mechanics work, and which aren’t as effective. Keep an eye on elements like different calls to action, the inclusion of rich media and copy length.
- Pay attention to when you tweet. Note which time of day and day of the week yields the highest engagement and impressions.
- Is your audience mobile? If yes, is your site mobile friendly?
Bonus Pro Tip
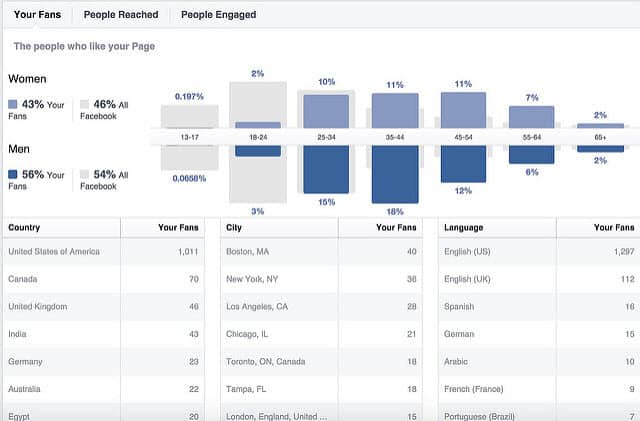
If you are feeling adventurous and a master of your data, try this tip from Shift Communications.
Shift suggests comparing your Twitter analytics reports to your Facebook analytics reports.
How are your two audiences similar? How are they different? With enhanced data from Twitter, you can now better understand if you’ve got the same audience or two very different audiences, and use that information to guide your content strategy.
___
Don’t’ like the data you discovered in your Twitter analytics? Want better results from Twitter? Continue reading seven key ways to get more clicks from each tweet.


